GCSE Tutoring Programme
Our chosen students improved 1.19 of a grade on average - 0.45 more than those who didn't have the tutoring.
This topic is relevant for:

Box Plot
Here we will learn about a box plot, including how to draw a box plot to represent a set of data, how to read data from a box plot, and how to interpret and compare box plots.
There are also box plot worksheets based on Edexcel, AQA and OCR exam questions, along with further guidance on where to go next if you’re still stuck.
What is a box plot?
A box plot is a diagram showing the following information for a set of data.
- Lowest value or smallest value
- Lower quartile or first quartile (LQ)
- Median, middle number, or second quartile (M)
- Upper quartile or third quartile (UQ )
- Highest value or largest value
This set of descriptive statistics is called the five-number summary. The box plot must be featured on a scale to show these values clearly.

Box plots were invented by the mathematician John Tukey and are sometimes called box and whisker plots, with the ‘whiskers’ being the ends representing the lowest and highest values.
Box plots are particularly useful for data analysis when comparing two or more data sets; it is easy to make visual comparisons of average (median) and spread (range and interquartile range).
When data is skewed (i.e. the distribution of data is not symmetrical or near-symmetrical), or there are many outliers or extreme values, a box plot provides better data visualisation than other chart types or graphs.
If you study Mathematics at A Level or study Statistics further, you will learn about measures of skewness that use the quartiles, and how to identify different types of skewness visually on a box plot. If a box plot is perfectly symmetrical, the data could have a normal distribution.
When estimating the median and quartiles of a set of data from a cumulative frequency graph, it is very easy to then draw a box plot of this data.
Step-by-step guide: Cumulative frequency (Example 4) (coming soon)
What is a box plot?

How to draw a box plot
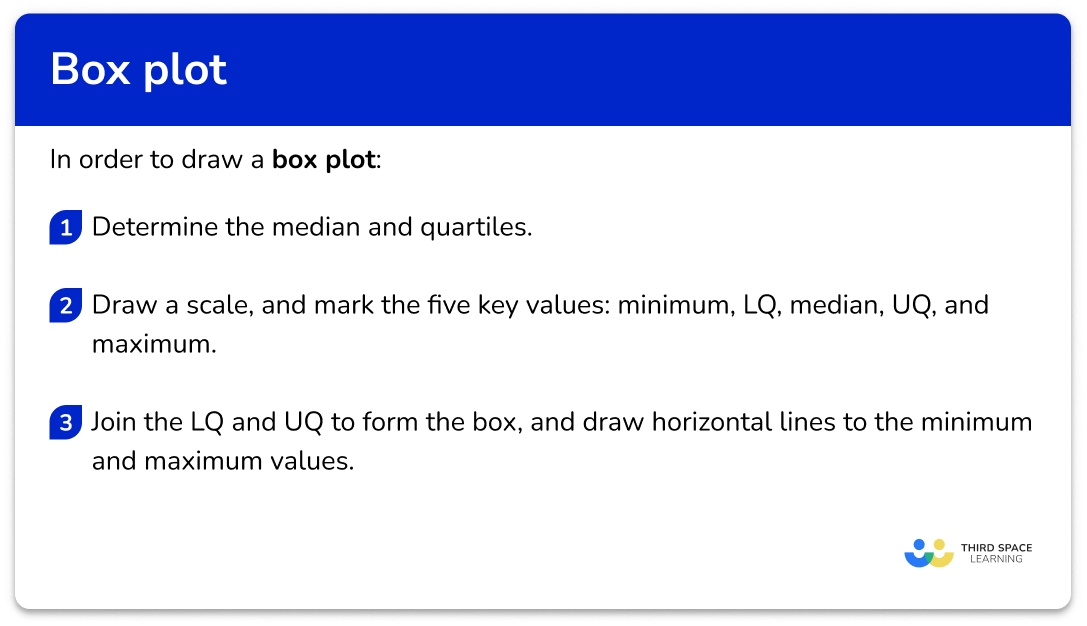
In order to draw a box plot:
- Determine the median and quartiles.
- Draw a scale, and mark the five key values: minimum, \bf{LQ} , median, \bf{UQ} , and maximum.
- Join the \bf{LQ} and \bf{UQ} to form the box, and draw horizontal lines to the minimum and maximum values.
Explain how to draw a box plot
Box plot worksheet
Get your free box plot worksheet of 20+ questions and answers. Includes reasoning and applied questions.
DOWNLOAD FREE Box plot worksheet
Get your free box plot worksheet of 20+ questions and answers. Includes reasoning and applied questions.
DOWNLOAD FREERelated lessons on cumulative frequency
Box plot is part of our series of lessons to support revision on cumulative frequency. You may find it helpful to start with the main cumulative frequency lesson for a summary of what to expect, or use the step by step guides below for further detail on individual topics. Other lessons in this series include:
Box plot examples
Example 1: drawing a box plot from a five-number summary
Draw a box plot using the following information.
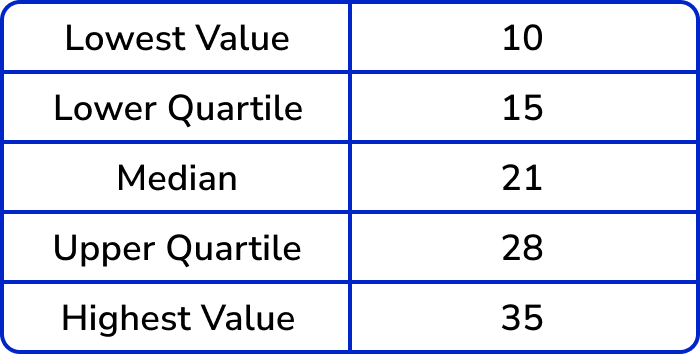
- Determine the median and quartiles.
In this example, all of the values are given.
2Draw a scale, and mark the five key values: minimum, \bf{LQ} , median, \bf{UQ} , and maximum.
The scale needs to be long enough to mark on the lowest and highest values, so in this example, we use 0 to 40.
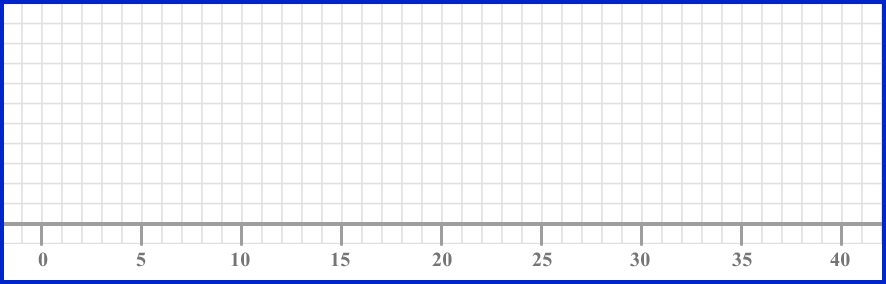
Mark the five key values with vertical lines.
3Join the \bf{LQ} and \bf{UQ} to form the box, and draw horizontal lines to the minimum and maximum values.
The box runs from the lower quartile (15) to the upper quartile (28). The whiskers join to the box; the lower whisker ends at the minimum value (10) and the upper whisker ends at the maximum value (35).
Example 2: drawing a box plot for a given data set
Draw a box plot for the following data points.
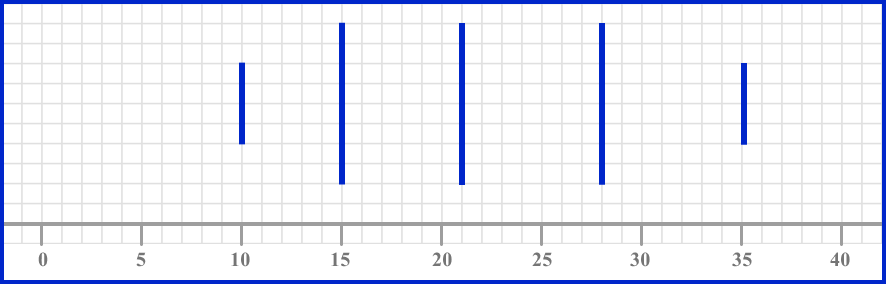
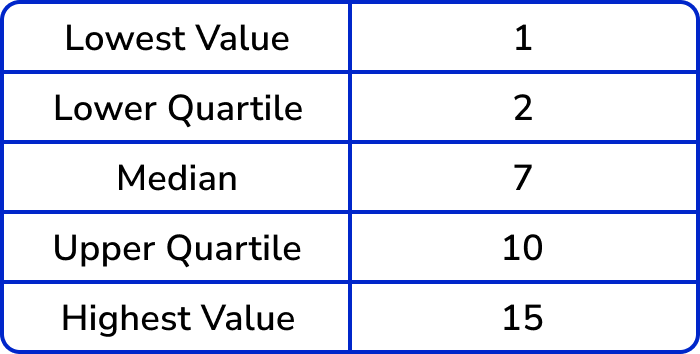
1, \; 1, \; 2, \; 3, \; 5, \; 7, \; 7, \; 8, \; 10, \; 12, \; 15Determine the median and quartiles.
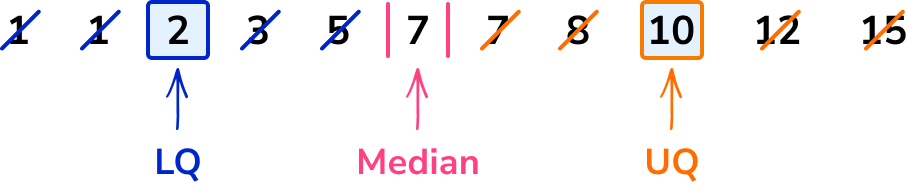
Draw a scale, and mark the five key values: minimum, \bf{LQ} , median, \bf{UQ} , and maximum.
The scale needs to be long enough to mark on the lowest and highest values, so in this example, we use 0 to 20.
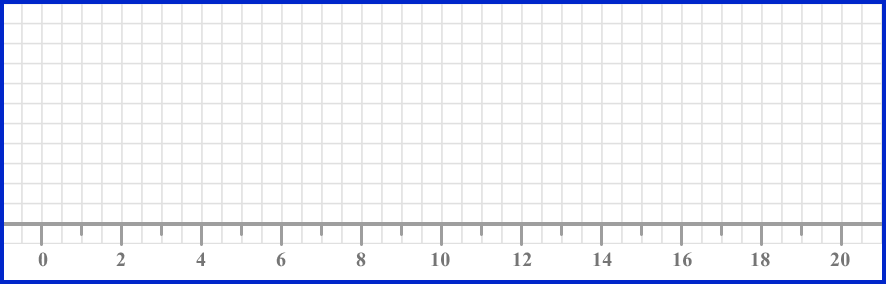
Mark the five key values with vertical lines.
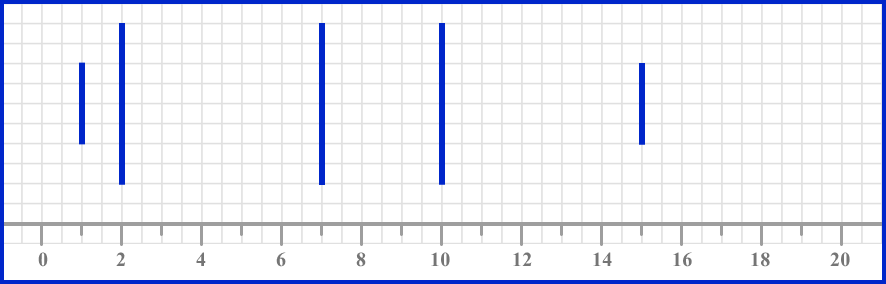
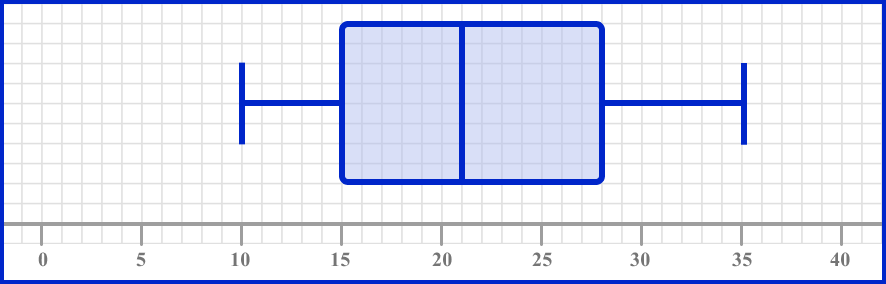
Join the \bf{LQ} and \bf{UQ} to form the box, and draw horizontal lines to the minimum and maximum values.
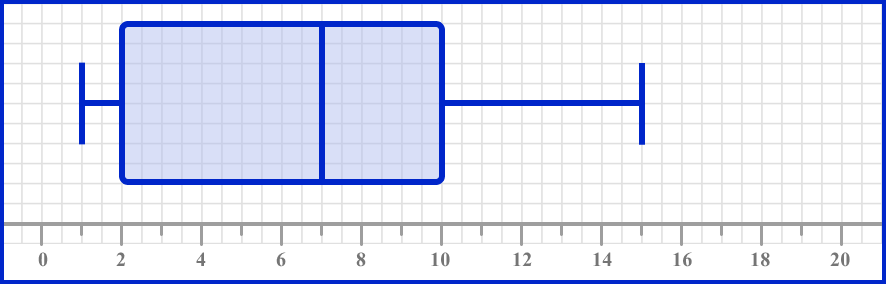
The box runs from the lower quartile (2) to the upper quartile (10). The whiskers join to the box; the lower whisker ends at the minimum value (1) and the upper whisker ends at the maximum value (15).
Example 3: drawing a box plot when all five key numbers are not given
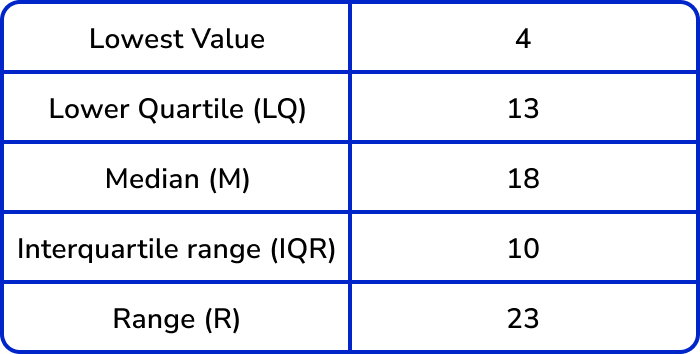
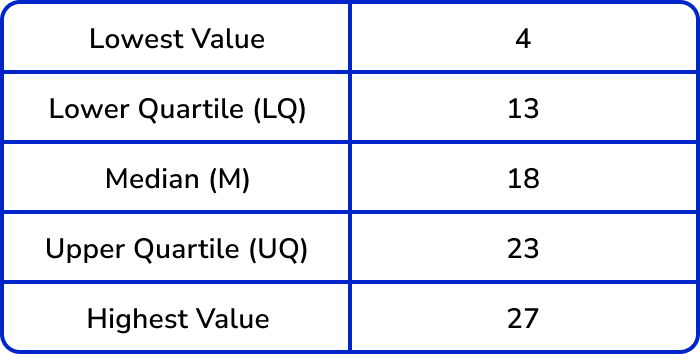
This table shows some descriptive statistics for a set of data.
Determine the median and quartiles.
In this problem, we are given the IQR and range, and we need to work out the upper quartile and highest value.
UQ=LQ+IQR, \; so \; UQ=13+10=23
Similarly, \text{range}=\text{highest value}-\text{lowest value}, \; so \; \text{lowest value}+\text{range}=\text{highest value}.
So we do 4+23=27; the highest value is 27.
The key values for the box plot are as follows.
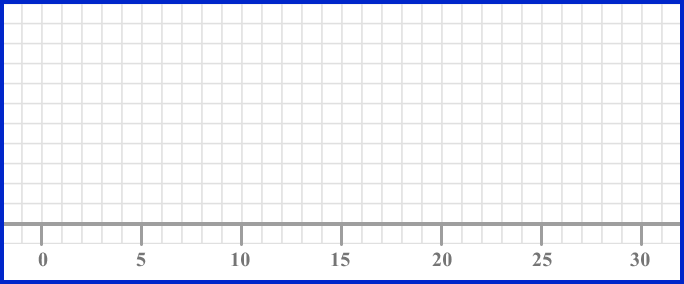
Draw a scale, and mark the five key values: minimum, \bf{LQ} , median, \bf{UQ} , and maximum.
The scale needs to be long enough to mark on the lowest and highest values, so in this example, we use 0 to 30.
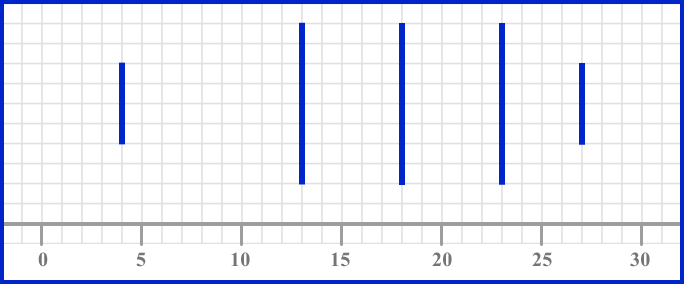
Mark the five key values with vertical lines.
Join the \bf{LQ} and \bf{UQ} to form the box, and draw horizontal lines to the minimum and maximum values.
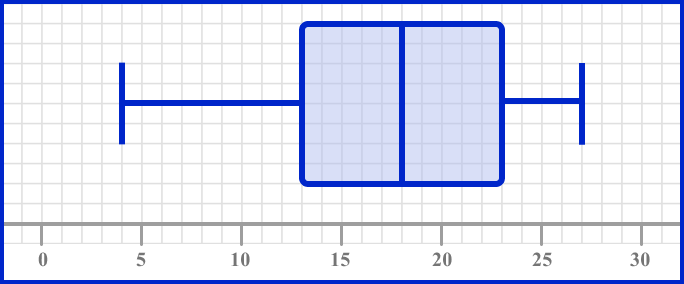
The box runs from the lower quartile (13) to the upper quartile (23). The whiskers join to the box; the lower whisker ends at the minimum value (4) and the upper whisker ends at the maximum value (27).
Comparison of distributions
It is important to be able to read key information from a box plot, and also to compare distributions of two box plots.
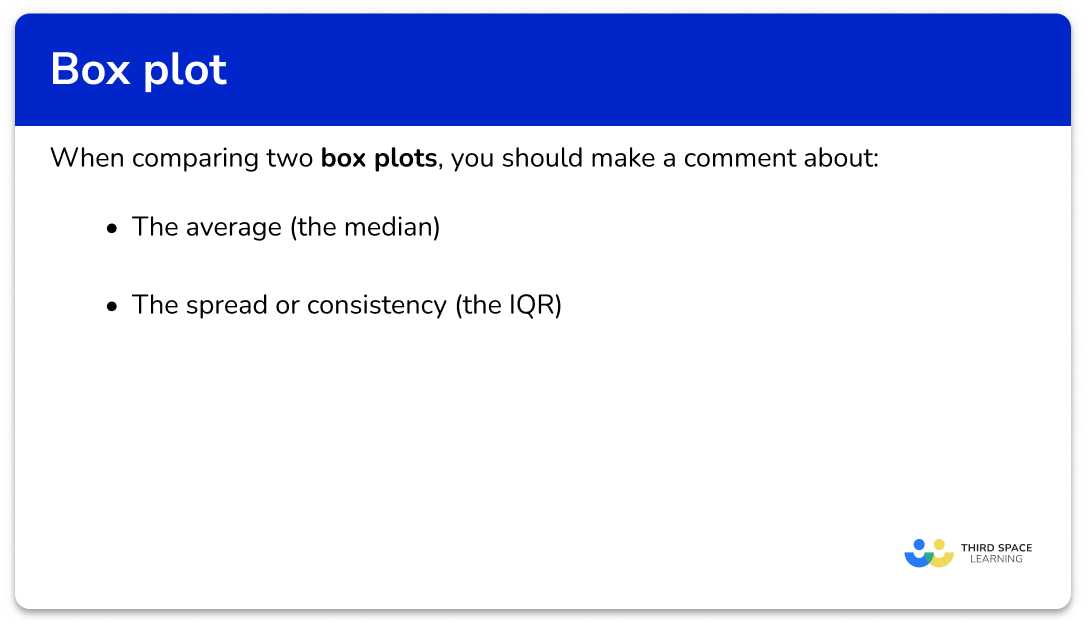
When comparing two box plots, you should make a comment about:
- The average (the median) – i.e. which is higher/larger on average;
- The spread or consistency (the interquartile range or IQR) – a greater IQR means that data points are more spread out, and therefore less consistent.
The comparison must be put into context of the question.
For example,
Box plot A shows the length of words in a book for a 5 year old child.
Box plot B shows the length of words in a book for an 8 year old child.
If the median is higher for box plot B, the contextual solution would be:
The median word length is longer in book B than in book A.
Or
The median word length is lower in book A than in book B.
When describing the spread of the data, if the interquartile range of the data is a larger value for book B than book A, the contextual solution would be:
The word lengths in book B are more spread out than in book A.
Or
The word lengths in book A are more concise than in book B.
How to compare distributions
Example 4: reading information from a box plot
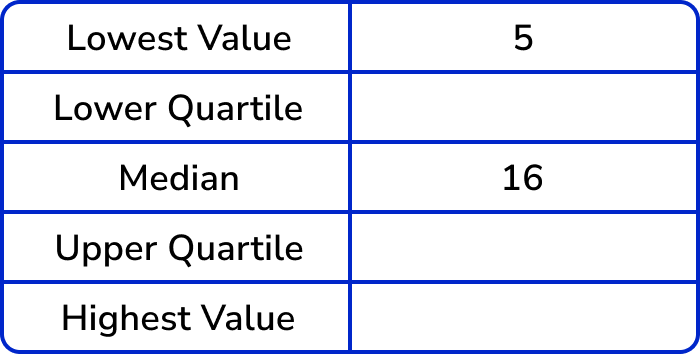
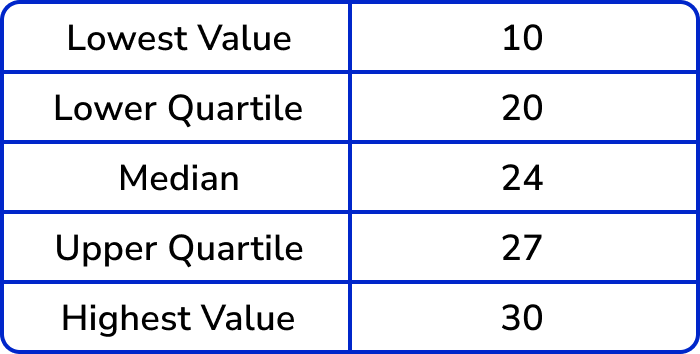
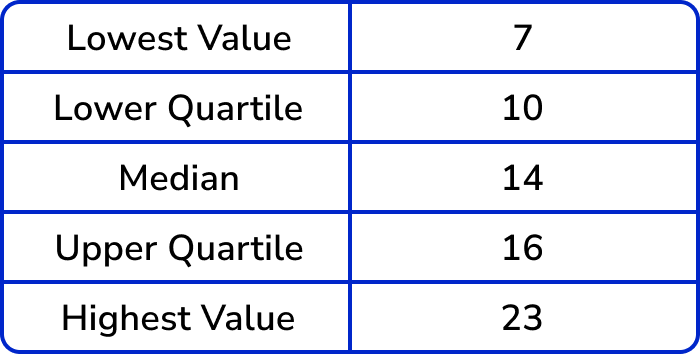
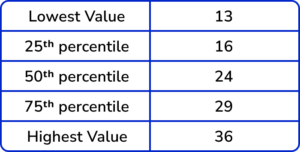
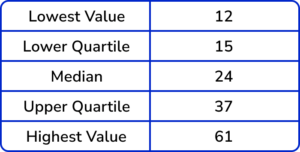
This table shows some descriptive statistics for a set of data.
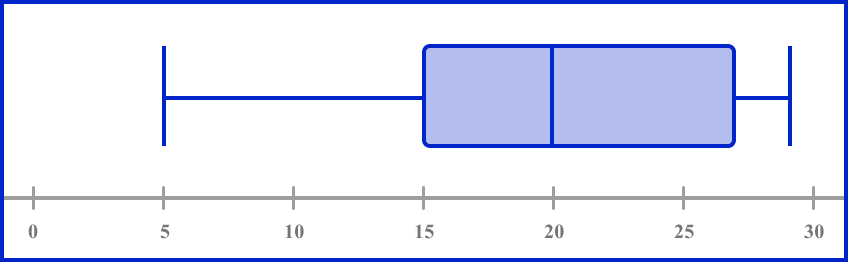
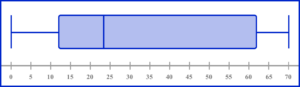
This box plot represents the same set of data.
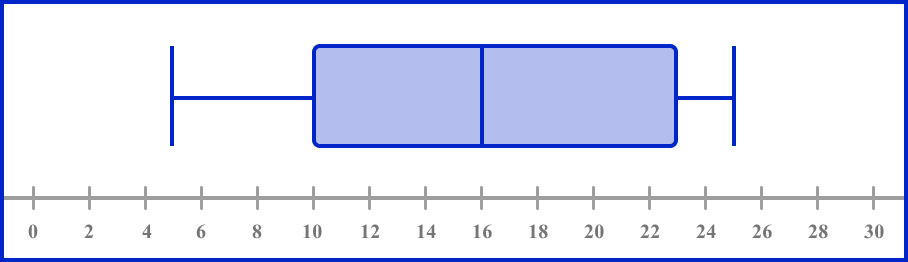
Use the box plot to fill in the missing information in the table.
Identify the lower quartile.
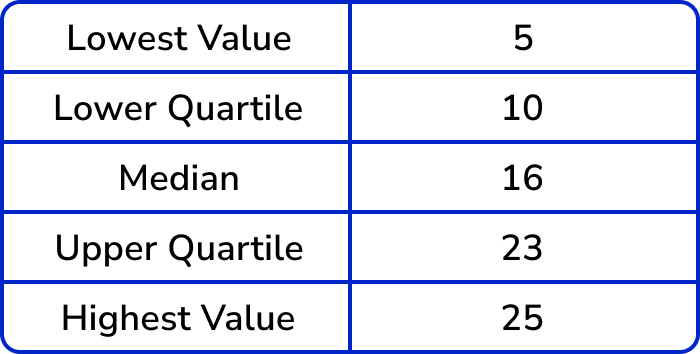
The lower quartile is the vertical line on the box plot at the lower end (left end) of the box. Reading the data value off the x -axis, the lower quartile is 10.
Identify the upper quartile.
The upper quartile is the vertical line at the upper end (right end) of the box. Reading the data value off the x -axis, the upper quartile is 23.
Identify the highest value.
The upper whisker ends at the highest value; this is 25.
The completed table is therefore,
Example 5: comparing two box plots
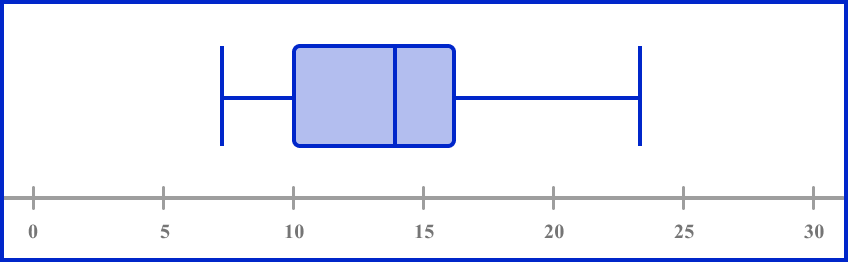
Two classes of students sat the same Maths test. The two box plots below show a summary of their results.
Class A

Class B
Compare these two sets of data.
Compare the medians to comment on the average.
The median for Class A is 14.
The median for Class B is 20.
This means that, ‘on average, Class B scored better marks on the test than Class A’.
Alternatively, you could state something like ‘the median mark in Class A was less than the median mark in Class B’.
At GCSE level, your answer must compare the two values – it is not sufficient to just state the two medians. You also need to give context – so in this example, refer to the classes and marks scored on the tests, rather than just ‘A has a smaller median’.
Compare the \bf{IQR} (or range) to comment on the spread or consistency.
The interquartile range (IQR) for Class A is 6.
The IQR for Class B is 12.
This means that, ‘Class A were more consistent than Class B’. This just means that marks for Class A were more closely bunched together, whereas the marks for Class B were more spread out.
Alternatively, you could state ‘Class B had a larger interquartile range than Class A’.
At GCSE level, your answer must compare the two values – it is not sufficient to just state the two IQRs or ranges. You also need to give context – so in this example, refer to the classes and marks scored on the tests, rather than just ‘A has a smaller IQR ’.
Example 6: comparing two box plots
Class A (see Example 5) also sat an English test. Their marks are summarised below. Compare the distributions of marks on the Maths and English tests.
English
Maths
Convert the data into the same format.
If we read the key data value from the Maths box plot, we get the following five-number summary for Maths marks:
Compare the medians to comment on the average.
The median value for English is 24.
The median value for Maths is 14.
This means that, ‘on average, the class scored higher marks on the English test than on the Maths test’.
Alternatively, you could state something like ‘the median mark in English was higher than the median mark in Maths’.
Remember, your answer must compare the two values – it is not sufficient to just state the two medians. You also need to give context – so in this example, refer to both of the subjects and marks scored on the tests, rather than just ‘English has a smaller median’.
Compare the IQR (or range) to comment on the spread or consistency.
The IQR in English is 7 and the IQR in Maths is 6.
This means that, ‘there was similar variability of marks in Maths and English’. There was a similar bunching together of the middle 50\% of the data.
Alternatively, you could state something like ‘the interquartile range of marks scored in English was nearly the same as the interquartile range of marks in Maths’.
Remember, your answer must compare the two values – it is not sufficient to just state the two IQRs or ranges. You also need to give context – so in this example, refer to both of the subjects and marks scored on the tests, rather than just ‘the IQRs are the same’.
Note that you could also answer this question by drawing a box plot of the English data – and it’s a very common type of GCSE exam question to be asked to draw a box plot in the first part of a question, then compare this box plot with another in the second part of the question. Whichever method is required, the analysis is the same.
Common misconceptions
- Drawing the ends of the whiskers right to the ends of the plot scale
The whiskers should run from the minimum to the maximum value, not the full length of the scale.
- Forgetting to order the data set before finding the median or quartiles
If you are given a data set to represent on a box plot, make sure the list of values is in order before you start finding the key values.
- Not giving context when comparing box plots
Remember to refer to the context or topic in the question – for example, if the question asks about heights of children, your answer should be something like: ‘on average, the children in group A are taller than the children in group B’.
- Incomplete box plot
All of the five-number summary values should feature on the box plot. Make sure your lines are clear on your diagram along with the scale.
Practice box plot questions
1. Draw a box plot to show this five-number summary.


The ends of the whiskers are plotted at the minimum and maximum values. Draw lines for the LQ, median and UQ, and connect these to form the box.
2. Draw a box plot to show this set of data.


The data set is in order and so the five key values for the box plot are as follows.
Step-by-step guide: Quartiles
The ends of the whiskers are plotted at the minimum and maximum values. Draw lines for the LQ , median and UQ , and connect these to form the box. Draw the line from the lowest value to the lower quartile, and from the upper quartile to the highest value.
3. Look at this box plot.

What is the value of the lower quartile?
The lower quartile is the lower end of the box – this is the value 11.
4. Look at this box plot.

What is the value of the median?
The median is the vertical line running through the middle of the box between the lower quartile and the upper quartile – this is the value 30.
5. Look at these two box plots and choose the incorrect statement:
A:

B:

A and B have the same median.
A and B have the same range.
The maximum value of B is larger than the maximum value of A.
The interquartile range of A is smaller than the interquartile range of B.
The IQR of A is 40-24=16.
The IQR of B is 36-16=10.
So the IQR of A is larger than the IQR of B.
6. The two box plots show the English and Maths test results of a class of Year 10 students. Choose the statement below that is incorrect.
English

Maths

On average, the class scored better in Maths than in English.
The highest mark in English was greater than the highest mark in Maths.
The lowest mark in English was less than the lowest mark in Maths.
There was similar variability in scores in English and Maths.
The highest mark in English was 52.
The highest mark in Maths was 56.
Therefore the highest mark in English was less than the highest mark in Maths, and the statement is incorrect.
Box plot GCSE questions
1. Here is some information about the birth weights of a group of babies.
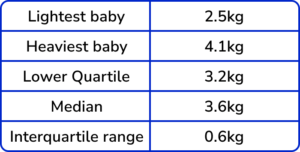
Here is a box plot drawn to show this information.
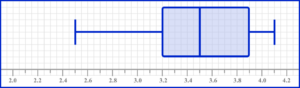
Make two criticisms of the box plot.
(2 marks)
The median has been drawn at 3.5 instead of 3.6 .
(1)
The upper quartile should be at 3.8 instead of 3.9 .
(1)
2. Here is some information about the ages of 60 people attending a local club.
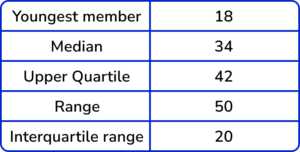
(a) Use the scale below to draw a box plot to represent this information.
(b) Work out an estimate for the number of members with an age between 18 and 42.
(6 marks)
(a)
LQ=42-20=22
(1)
Highest value = 18+50=68
(1)
Drawing a box with three correctly plotted values.
(1)
Fully correct box plot.
(1)
(b)
60\times{0.75}
(1)
45(1)
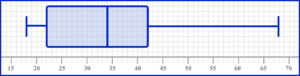
3. Here is some information about the length of time people spent in a shopping centre on a weekend.
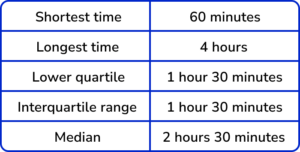
(a) Draw a box plot to show this information.
(b) The box plot below shows the lengths of time people spent at the same shopping centre on a weekday.

Make two comments to compare the distributions.
(5 marks)
(a)

UQ = 1.5 \ hours + 1.5 \ hours = 3 \ hours = 180 \ minutes
(1)
Drawing a box with three correctly plotted values
(1)
Fully correct box plot
(1)
(b)
The median/average time spent at the shopping centre on the weekend was greater than on a weekday (oe)
(1)
The range/interquartile range of times spent at the shopping centre were the same OR both sets of data have the same variability (oe)
(1)
Learning checklist
You have now learned how to:
- Use appropriate graphical representations involving discrete, continuous and grouped data (including box plots)
- Describe, interpret and compare observed distributions of a single variable through: appropriate graphical representation involving discrete, continuous and grouped data; and appropriate measures of central tendency (mean, mode, median) and spread (range, consideration of outliers)
The next lessons are
Still stuck?
Prepare your KS4 students for maths GCSEs success with Third Space Learning. Weekly online one to one GCSE maths revision lessons delivered by expert maths tutors.

Find out more about our GCSE maths tuition programme.